Geo Visualization
From WebLichtWiki
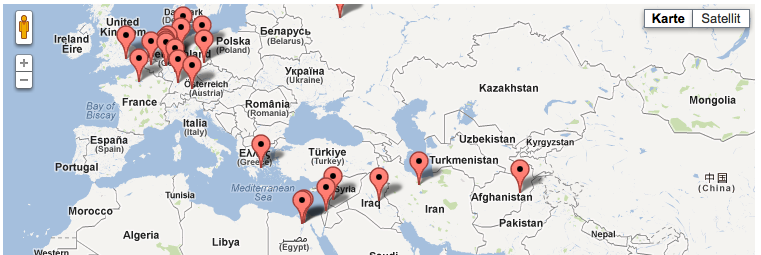
After a Named Entity Recognizer was applied to a text, a succeeding application could be a geographical visualization of the named entities of type location. Such a tool enriches the locations found in a text with geographic information, especially in the form of longitude and latitude. In a next step, the geographic visualizer can compile a visualization of the geographic locations in a data format that can be used by Geographic Information Systems (GIS, for example Google Maps or OpenStreetMaps) to render a map. For a geographic visualization, a database that combines the names of locations with their geographical coordinates is necessary. Such databases are available as web services on the net, for example http://www.geonames.org/. Other organizations are offering this kind of data to be downloaded as a database dump. Depending on the available data and the actually used GIS, the geographic locations in a text can be marked as points on the map (for example, cities). In a more sophisticated approach, whole areas can be visualized, for example countries like "Germany" or regions like the "Middle East". A geographic visualizer has to deal with the problem of ambiguity: even in Germany there are already two different cities named "Frankfurt", where around the world you can find many more locations with that name.
An example for a Geo Visualization, done in WebLicht:
